

KJH
Prometheus Loki 본문
Loki는 인프라 로그 시스템이다.
Loki 후기를 먼저 남기면 EFK 스택보다 구성 및 사용이 훨씬 편하게 느껴졌고, 상당히 마음에 들었다.
두개의 툴을 써야만 가능했던 시나리오를 하나에서 모두 사용하니 안쓸 이유가 없었기도 하다.
Observability 도구인 LGTM 스택이 신조어로 등장했는데, 해당 스택의 구성 요소는 Loki, Grafana, Mimir(장기 저장 솔루션),Tempo(trace) 이고,
이 자료에선 k8s, windows로그들을 Loki로 보내서 grafana로 조회 해보려고 한다.

- Gateway: routing 룰이 적용된 nginx 서버로 loki로 proxy 해줍니다.
- Distributor: 들어오는 로그 데이터를 여러 ingester에 분산시켜, 데이터의 부하를 분산시킵니다.
- Ingester: 수집된 로그 데이터를 임시 저장(Memory)하고 배치 처리하여 저장소(s3)에 저장합니다.
- Querier: 저장된 로그 데이터에 대한 쿼리를 처리하고 결과를 반환합니다.
- Query-Frontend: 쿼리의 성능을 향상시키기 위해 쿼리 최적화, 분할, 캐싱 등을 관리합니다.
사용된 helm charts
| Helm chart | Version | Link |
| loki-distributed | v0.78.0 | https://github.com/grafana/helm-charts/tree/main/charts/loki-distributed |
| promtail | v6.15.3 | https://github.com/grafana/helm-charts/tree/main/charts/promtail |
| win promtail | v2.8.7 | https://github.com/grafana/loki/releases/download/v2.8.7/promtail-windows-amd64.exe.zip |
| kube-prometheus-stack | v55.5.0 | https://github.com/prometheus-community/helm-charts/tree/main/charts/kube-prometheus-stack |
loki-distributed
storage_config 구성 (azure blob)
    storage_config:
      azure:
        environment: AzureGlobal
        account_name: xxx
        account_key: 'xxx'
        container_name: logs
        endpoint_suffix: ""

    compactor:
      shared_store: azure

  schemaConfig:
    configs:
    - from: "2020-09-07"
      store: boltdb-shipper
      object_store: azure
      schema: v11
      index:
        prefix: loki_index_
        period: 24h

  storageConfig:
    boltdb_shipper:
      shared_store: azure
      active_index_directory: /var/loki/index
      cache_location: /var/loki/cache
      cache_ttl: 168h
    filesystem:
      directory: /var/loki/chunks
gateway를 활성화 해서 proxy 기능 사용
gateway:
  enabled: true
promtail
client url 설정 (loki-gateway service이름으로 접근)
  clients:
    - url: http://loki-gateway/loki/api/v1/push
win promtail
loki-gateway에 ingress를 붙여서 https 접근
$configContent = @"
server:
  http_listen_port: 9080
  grpc_listen_port: 0

positions:
  filename: $installPath\positions.yaml

clients:
  - url: https://loki-gateway.test.com/loki/api/v1/push

scrape_configs:
  - job_name: windows_log
    static_configs:
      - targets:
          - localhost
        labels:
          job: windows_log
          __path__: C:\test\logs\*.log
          hostname: "$hostname"

  - job_name: windows_application_event_log
    pipeline_stages:
      - json:
          expressions:
            channel: channel
            source: source
            computer: computer
            event_id: event_id
            levelText: levelText
            timeCreated: timeCreated
            message: message
      - match:
          selector: '{event_id!="16384" and event_id!="16385" and event_id!="16386"}'
      - labels:
          message:
      - template:
          source: message_template
          template: '{{ .timeCreated }} {{ .computer }}/{{ .source }} [{{ .event_id }}] {{ .levelText }} - {{ .message }}'
      - output:
          source: message_template
    encoding: utf-8
    windows_events:
      use_incoming_timestamp: false
      bookmark_path: "./bookmark_application.xml"
      eventlog_name: "Application"
      xpath_query: '*'
      labels:
        job: windows_application_event_log
        hostname: "$hostname"

"@

$configContent | Out-File -FilePath $configPath -Encoding utf8
kube-promtheus-stack
datasource 등록
  additionalDataSources:
    - name: Loki
      uid: 123
      type: loki
      url: http://loki-gateway
      access: proxy
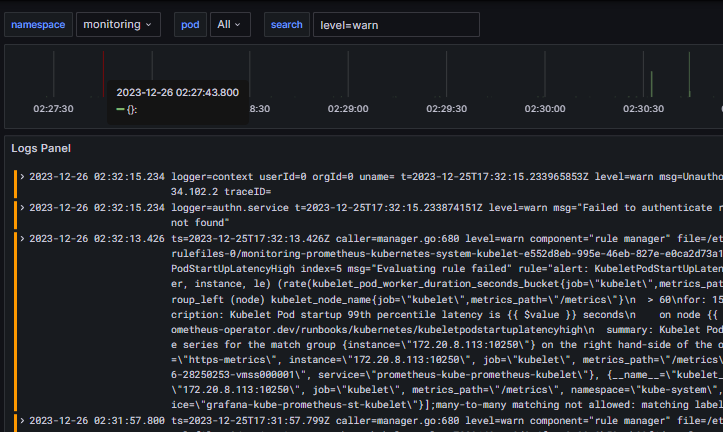
grafana에서 확인
※ windows 구성시 sc.exe 나 service 생성 cli로는 동작이 안됨,, nssm을 필수로 사용해야 합니다.
※ 로그 양이 많아지면 gateway에 429(Too Many Requests)에러가 생기고, 로그 수집에 제한이 생김
loki config에 아래 설정을 조절해서 수집량을 늘려야 합니다.
(즉 제한을 늘림에 따라 리소스 사용률도 증가하기에 적절하게 설정해야 합니다)
    limits_config:
      ingestion_rate_mb: 3000  # default 4, 초당 인제스팅 될 수 있는 데이터의 최대 크기를 메가바이트 단위로 설정합니다.
      ingestion_burst_size_mb: 2048 # default 8, 인제스팅 데이터의 최대 버스트 크기를 메가바이트 단위로 설정합니다.
※ 쿼리 량이 많아지면 dashboard 로딩 속도가 느림
기본 옵션 화면에 불러올게 많으면 당연히 속도 문제가 있음
variables로 적절한 필터 조건을 줘서 사용성을 개선 가능합니다.
variable간 의존성을 줘서 동작하게 가능 합니다.
label_name -> job -> hostname -> search


상황에따라 방식은 다르겠지만,
Job 쿼리를 우선으로 하여 기본화면에서 가급적 가벼운 쿼리를 하게 합니다.
(여기서 Job은 application 혹은 service 개념)
굳이 dashboard에 노출 시킬 필요가 없는 데이터라 Nothing으로 숨깁니다.

label_name을 전달 받아서 job list를 가장 먼저 뿌려 줍니다.

label_name과 선택한 job이 같은 경우의 hostname만 보여지게 합니다.


